Decode what it takes to innovate, adapt and grow
i2 Outcomes is a research-backed organizational diagnostic that reveals the hidden link between culture and business performance and shows leaders exactly where to act to drive measurable impact.
Informed by research data from leading organizations like:

The diagnostic is built on more than a decade of research and helps organizations identify the specific cultural and structural levers that most strongly influence innovation, adaptability and resilience.
The outcomes that matter & the levers that drive them
i2 Outcomes measures two things simultaneously:
Business performance outcomes
The results organizations want to strengthen in a rapidly changing environment.
Benchmarking your existing internal metrics enables progress tracking over time to provide a clear, organization-specific view of performance.
Organizational levers
The cultural and structural conditions leaders can influence to improve business performance outcomes.
Strengthening the right levers significantly increases the likelihood of achieving stronger business outcomes.

Stop guessing where to focus
Most organizations know they need to become more innovative and adaptive but struggle to know where to focus.
Without clear insight, companies often invest in:
- Broad transformation programs
- Generic leadership training
- Innovation initiatives targeting the wrong problems
i2 Outcomes removes this guesswork. It identifies the specific organizational conditions holding performance back, enabling leaders to focus time, resources and investment where they will have the greatest business impact.
Instead of doing more change, leaders can focus on the right change.
Three steps to clarity

Survey
A short diagnostic survey completed by leaders, managers and others with cross-organizational visibility.
±10 minutesInsights dashboard
Results are delivered through a rich, interactive dashboard that reveals patterns across teams, functions and levels.
Roadmap session
An expert-facilitated workshop helps leadership translate insights into a prioritized action roadmap.

Together, these steps transform diagnostic insight into practical, organization-specific change priorities.
What leaders learn
The priority actions that will create the biggest impact
Where innovation-enabling culture is strongest or weakest
The organizational conditions slowing performance
Quick wins and longer-term transformation priorities
Leadership, culture and skills gaps to address
The likely ROI of improving key levers
It also helps leaders identify pockets of excellence within the organization: teams or functions where culture and structure already support strong innovation and adaptability.
Hidden dynamics shaping performance
Beyond outcome and lever results, the diagnostic surfaces deeper patterns.
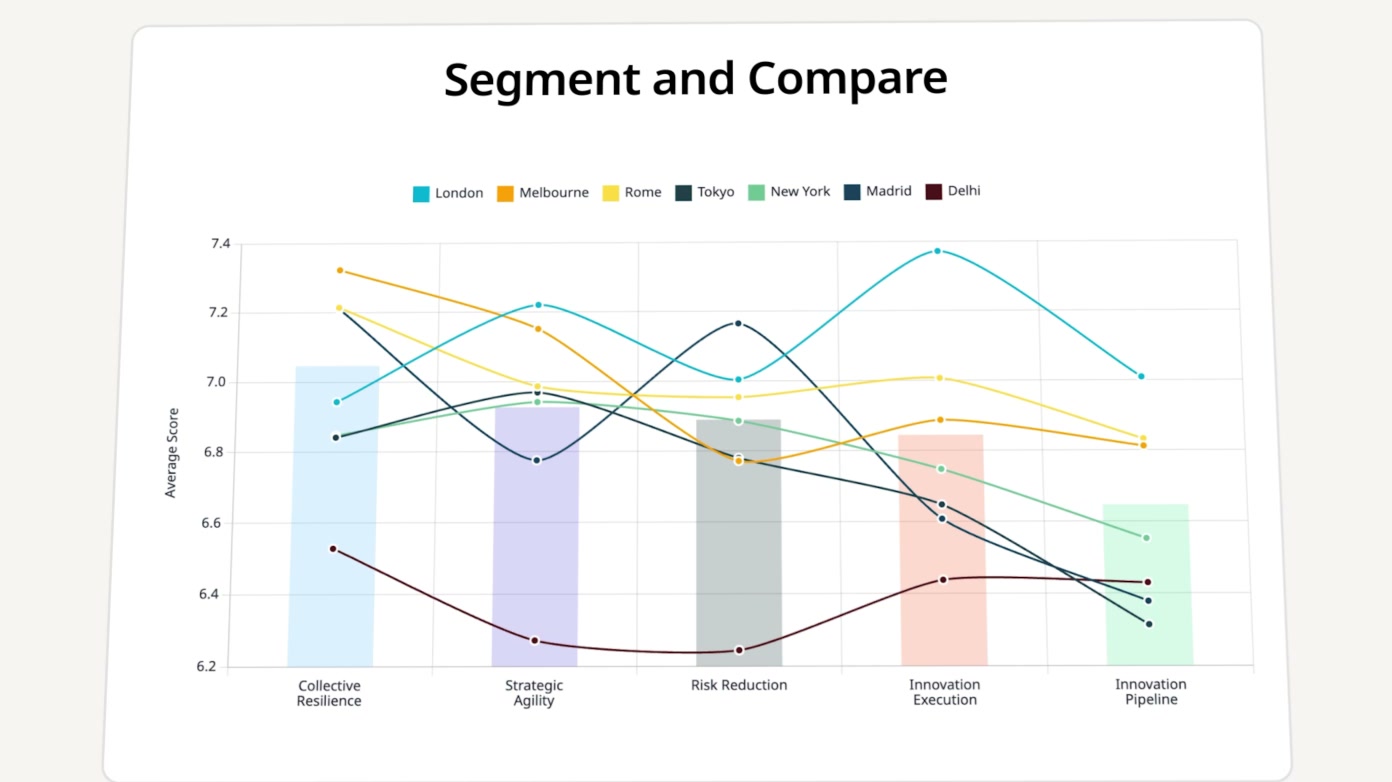
Segment and compare
Filter and compare results by role, business unit, location and country. Leaders can see exactly where strengths and gaps sit across the organization, rather than relying on a single headline average.

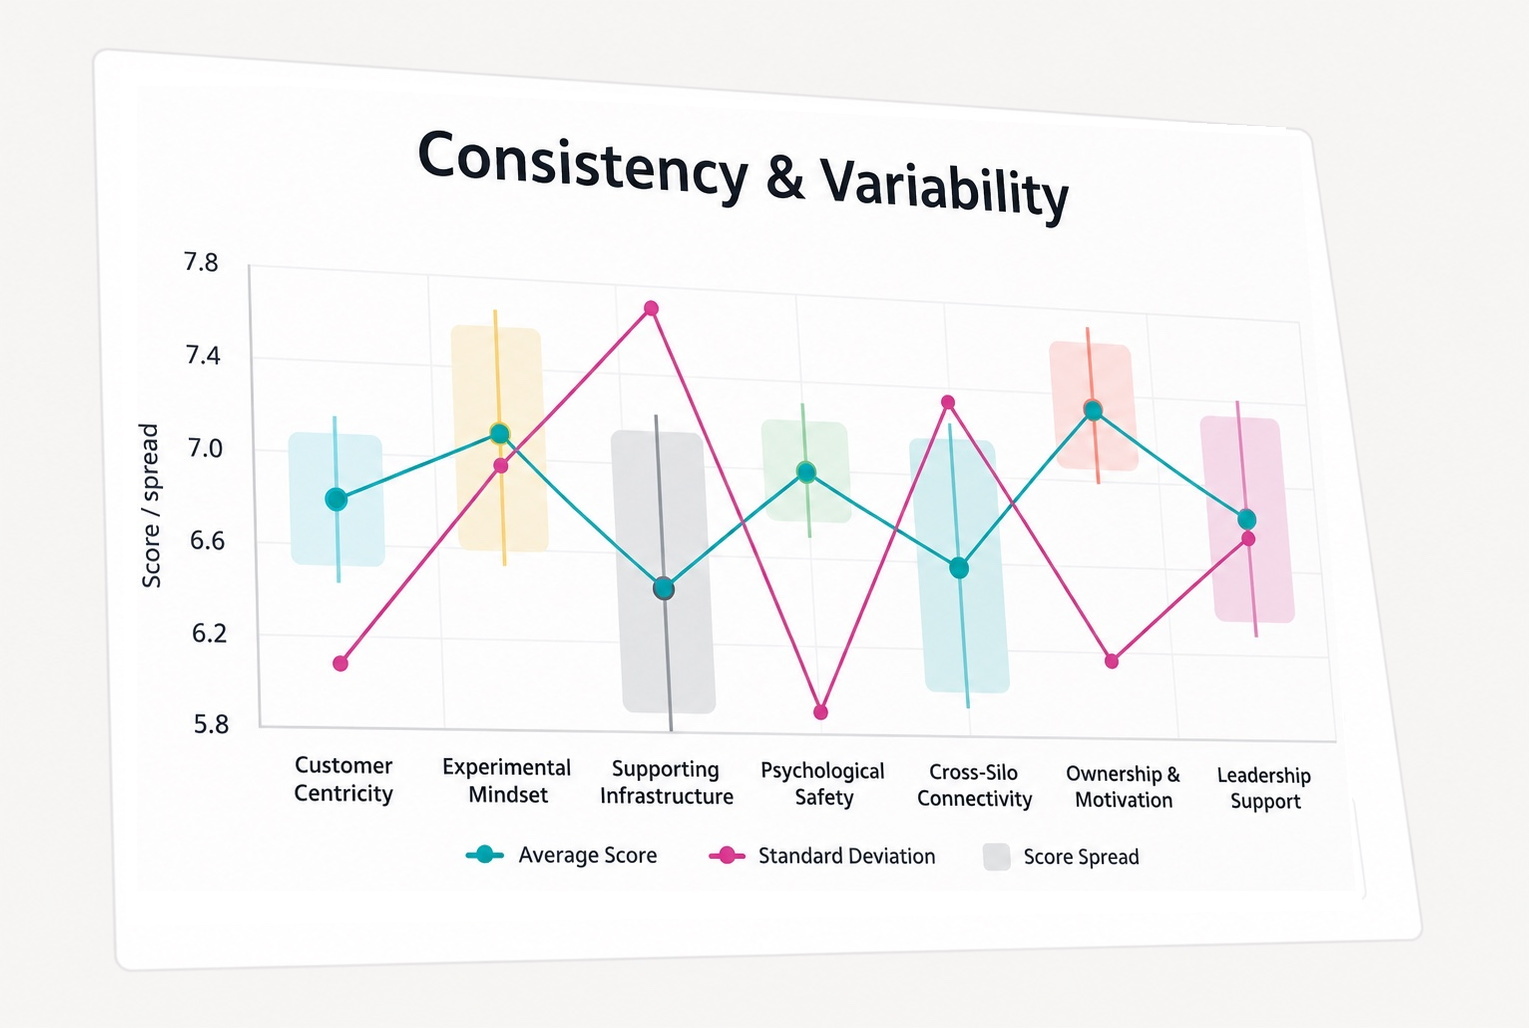
Consistency & variability
Standard-deviation toggles and score-spread charts show how tightly or widely results vary across the organization, making it clear where capability is embedded consistently and where it still depends on a few teams.
Overall Composite Score (OCS)
A single, high-level reference point for where your organization stands today. It brings together the values and practices that support innovation, adaptability and resilience, and accounts for how consistently those strengths show up across teams, placing your organization on a six-band maturity scale from Constrained to Leading.
Pair with the i2 Skills Assessment
Taken with the i2 Skills Assessment, we can identify the key innovation and problem-solving skills your people need to strengthen.
While i2 Outcomes diagnoses organizational conditions, the i2 Skills Assessment maps individual capabilities.
Learn about i2 Skills
What’s in your i2 Outcomes dashboard
Every result lives in an interactive dashboard, so leaders can move from the headline score to the detail behind it.
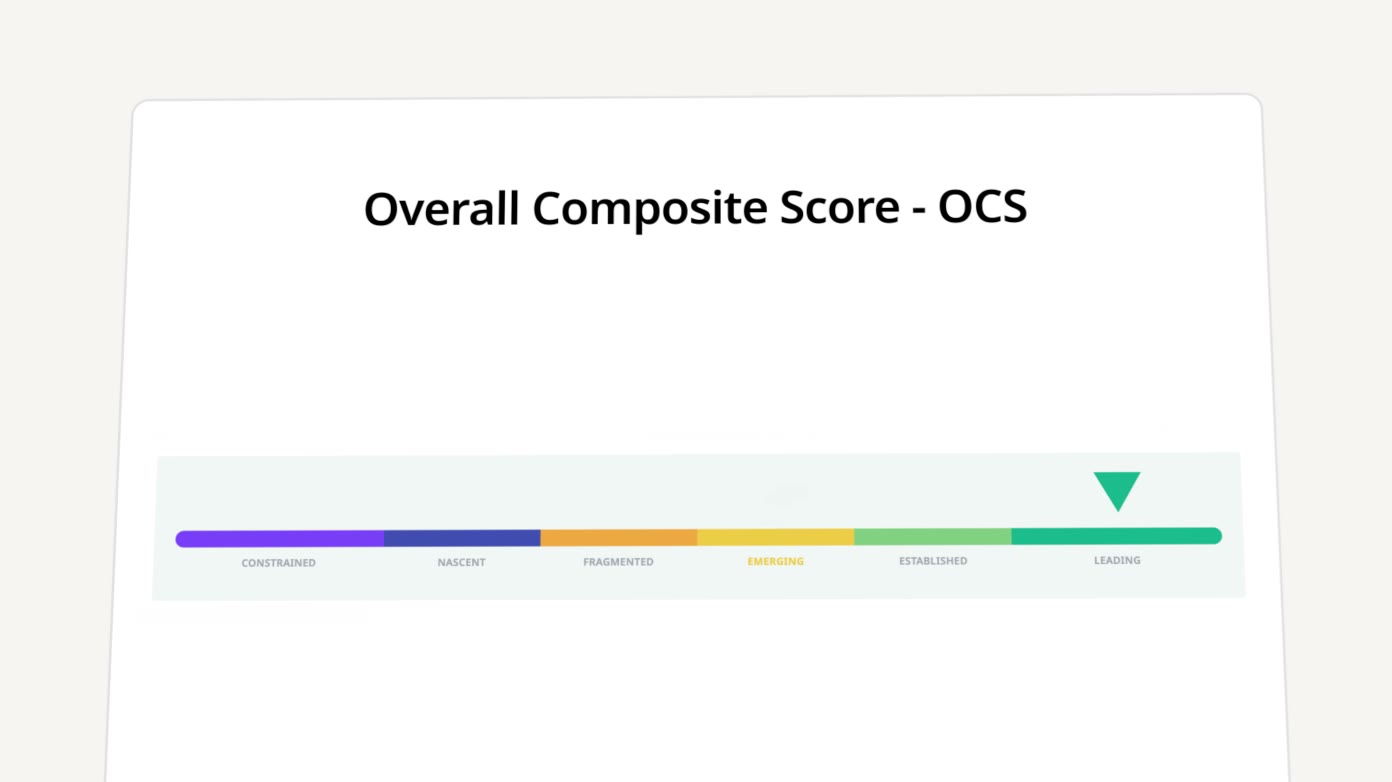
Overall Composite Score (OCS)
A single, high-level reference point for where your organization stands today. It is a composite of the values and practices that support innovation, adaptability and resilience, weighted by how consistently those strengths show up across the organization.
The OCS places your organization on a six-band maturity scale, from least to most mature, running from Constrained through to Leading.
The outcomes that matter
An at-a-glance bar chart across all five business outcomes, per-outcome cards showing the cohort average and the min-to-max range, and a breakdown of the values and practices behind each score.
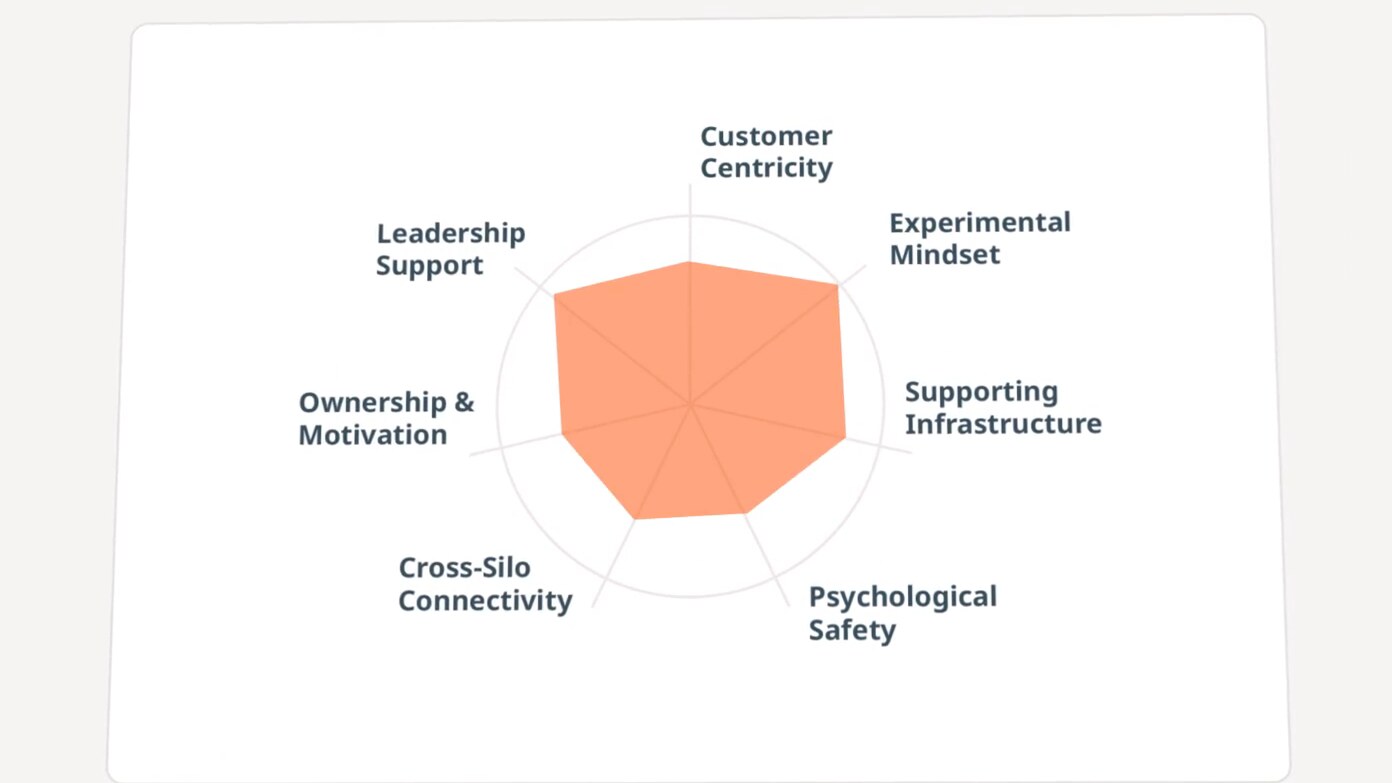
The conditions that drive them
The same family of charts applied to the organizational levers, the conditions leaders can influence to lift performance across multiple outcomes.
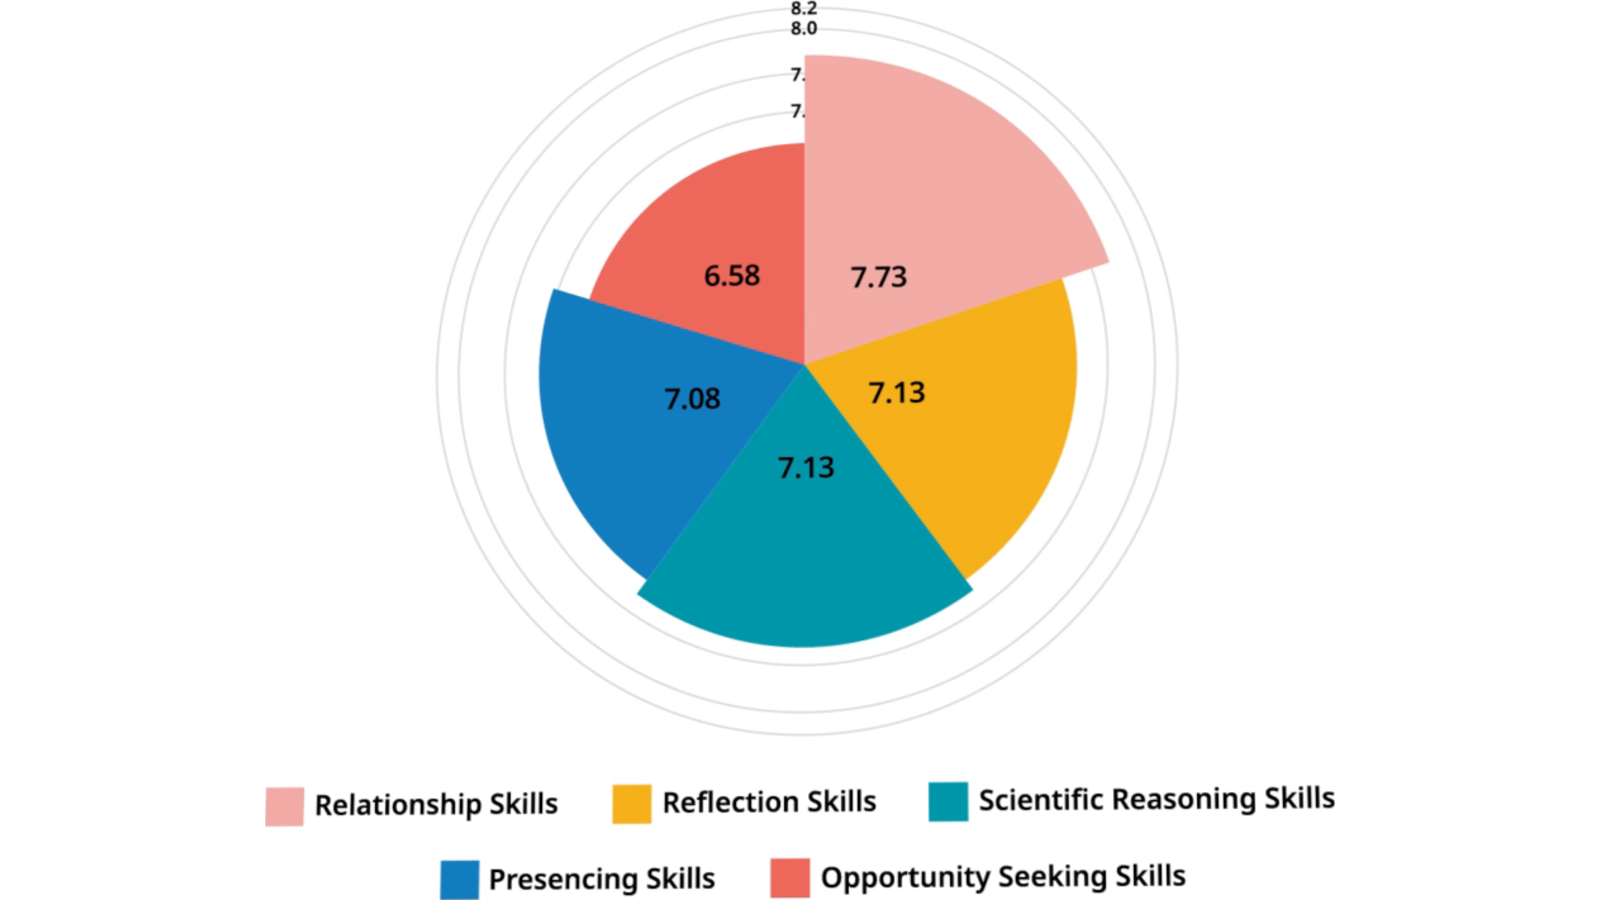
The capabilities people bring
Per-skill scores for the personal capabilities that drive innovation, with a breakdown of the behaviors underlying each one.
Strongest & weakest values & practices
A ranked list of the individual statements scoring highest and lowest: where the organization is already doing well, and where there’s the most room to improve.
Compare across the organization
Filter and compare every view by role, business unit, location and country, so leaders can see how results differ across the organization.
Consistency & variability
Standard-deviation toggles and score-spread charts reveal how tightly or widely results vary, showing the consistency behind the headline OCS.

Driven by data, not wishful thinking.
i2 Outcomes is based on over a decade of research conducted with over 100 corporate organizations by Jeanne Liedtka, one of the leading figures in the field of innovation.
Get updates on innovation culture research
Subscribe to receive insights on organizational innovation, culture diagnostics and leadership, delivered straight to your inbox.
Talk to an expert
Tell us a little about what you're looking for and a member of our senior team will be in touch. Prefer to pick a time? Book a consultation.